18
TEHO INTERNATIONAL INC LTD.
Annual Report 2015
FINANCIAL
HIGHLIGHTS
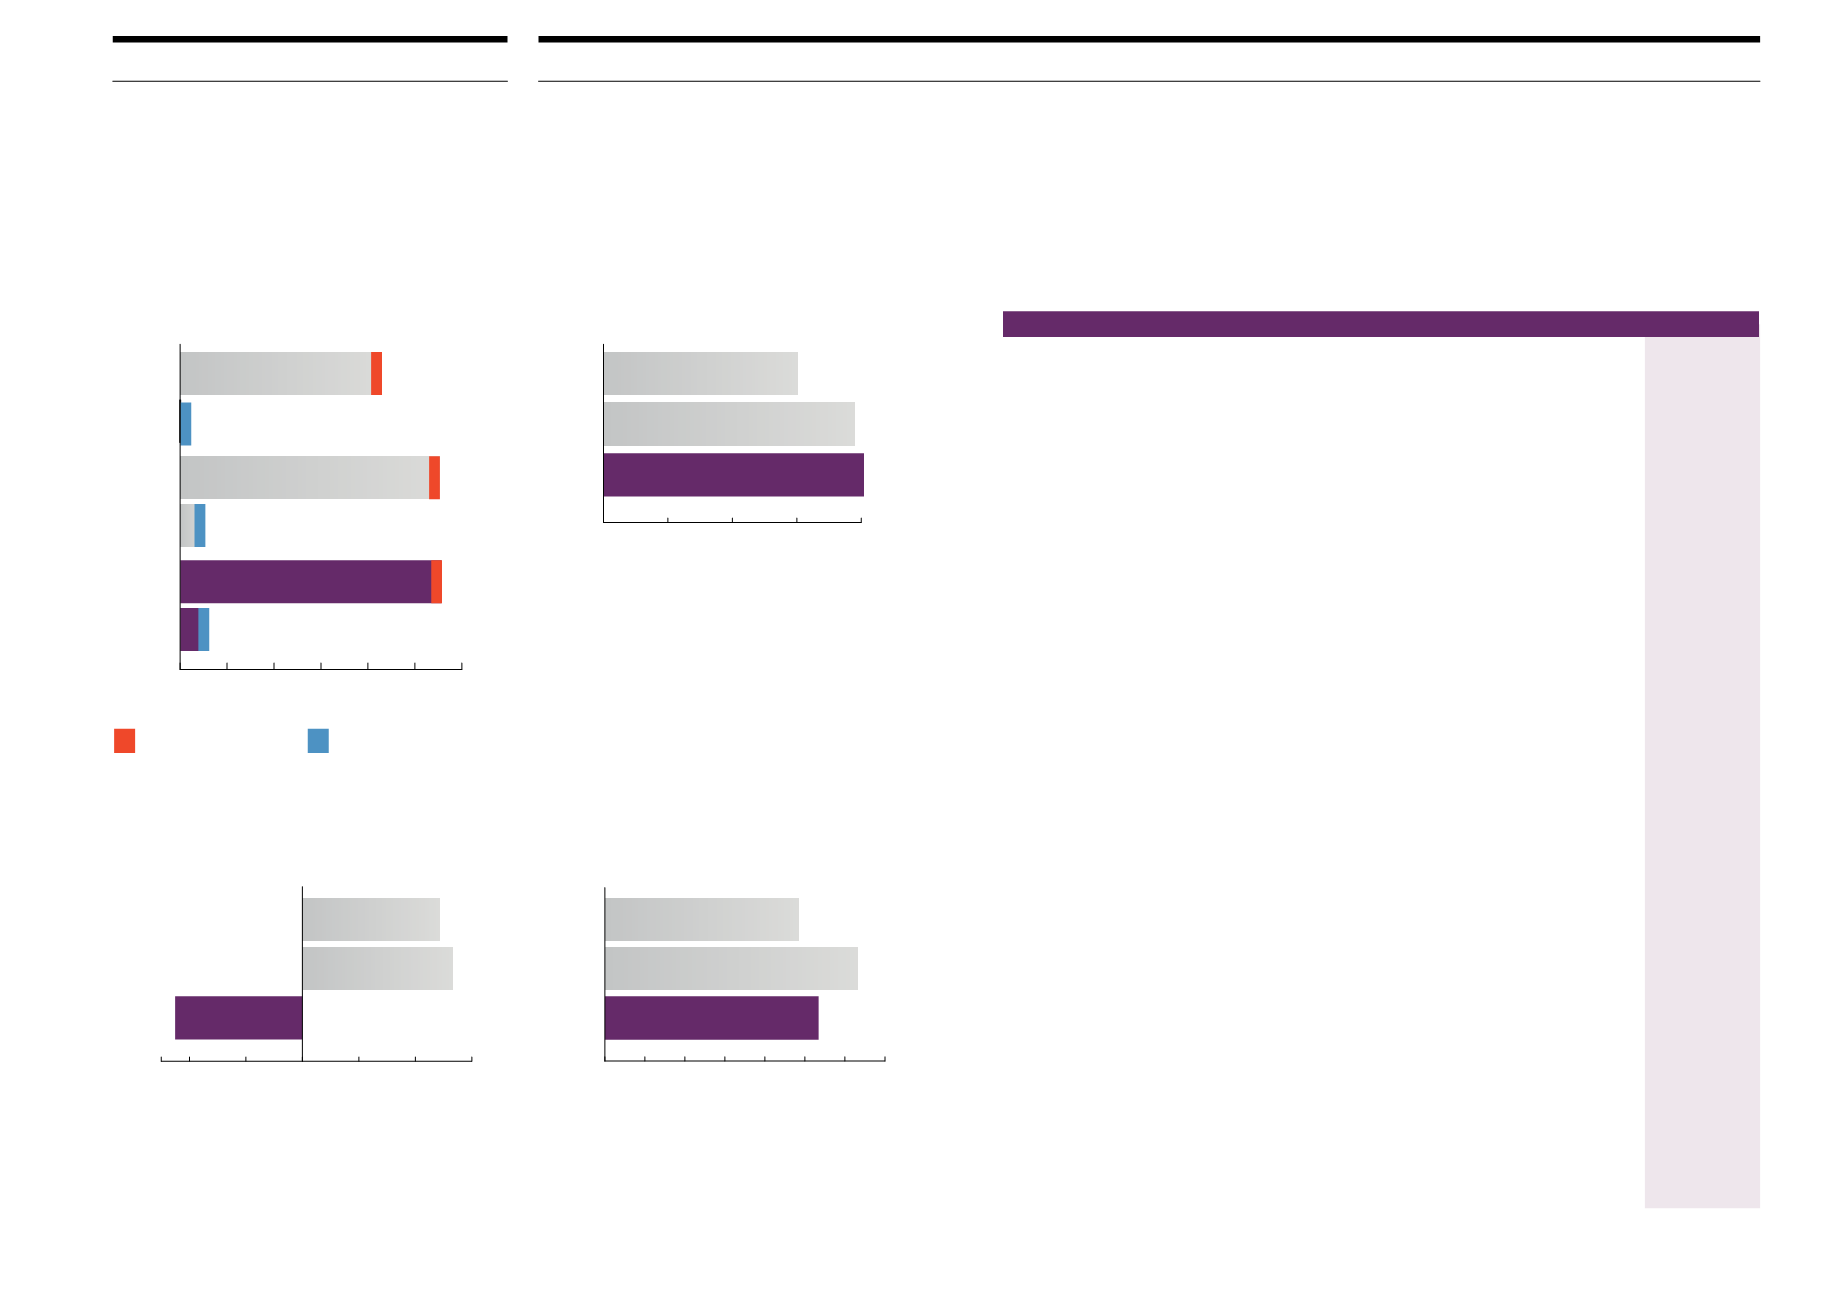
REVENUE ($’000)
EBITDA ($’000)
FY2013
FY2014
FY2015
REVENUE
By Operating Segments
Marine, Offshore Oil & Gas (S$ '000)
42,971
55,293
55,621
Property Development (S$ '000)
-
5,090
6,036
Total
42,971
60,383
61,657
By Geographical Areas
Singapore (S$ '000)
33,435
46,541
42,530
Rest of Asia (S$ '000)
5,164
5,057
8,784
Rest of the World (S$ '000)
4,372
8,785
10,343
Total
42,971
60,383
61,657
OPERATING RESULTS
Gross Profit (S$ '000)
13,947
18,045
18,669
EBITDA (S$ '000)
4,881
5,347
(4,507)
Profit/(Loss) Before Tax (S$ '000)
2,742
3,388
(7,456)
Profit/(Loss) After Tax (S$ '000)
2,381
3,392
(7,689)
Gross Profit Margin (%)
32.5
29.9
30.3
Return on Sales (%)
5.5
5.6
-12.5
Return on Assets (%)
4.9
2.8
-4.8
Return on Equity (%)
8.3
5.6
-9.2
Earnings Per Ordinary Share (Cents)
1.77
2.26
-3.54
Gross Dividends Per Share (Cents)
1.00
0.80
0.00
FINANCIAL POSITION
Total Assets (S$ '000)
48,907
123,343
160,444
Total Liabilities (S$ '000)
20,178
63,236
76,659
Shareholders' Equity (S$ '000)
28,729
60,107
62,313
NAV Per Ordinary Share (Cents)
24.30
31.50
26.71
GROSS PROFIT ($’000)
Marine, Offshore Oil
& Gas
Property Development
NAV PER ORDINARY SHARE
(CENTS)
0
42,971
6,036
55,621
5,090
55,293
FY
12/13
FY
12/13
FY
12/13
FY
12/13
FY
14/15
FY
14/15
FY
14/15
FY
14/15
FY
13/14
FY
13/14
FY
13/14
FY
13/14
0 10,000 20,000 30,000 40,000 50,000 60,000
13,947
18,045
18,669
0
5,000 10,000 20,000 30,000
0
2,000 4,000 6,000
5,347
4,881
(4,507)
0 500 1,000 1,500 2,000 2,500 3,000 3,500
31.60
24.30
26.71
-2,000
-4,000


