18
TEHO INTERNATIONAL INC LTD.
Annual Report 2016
FINANCIAL
HIGHLIGHTS
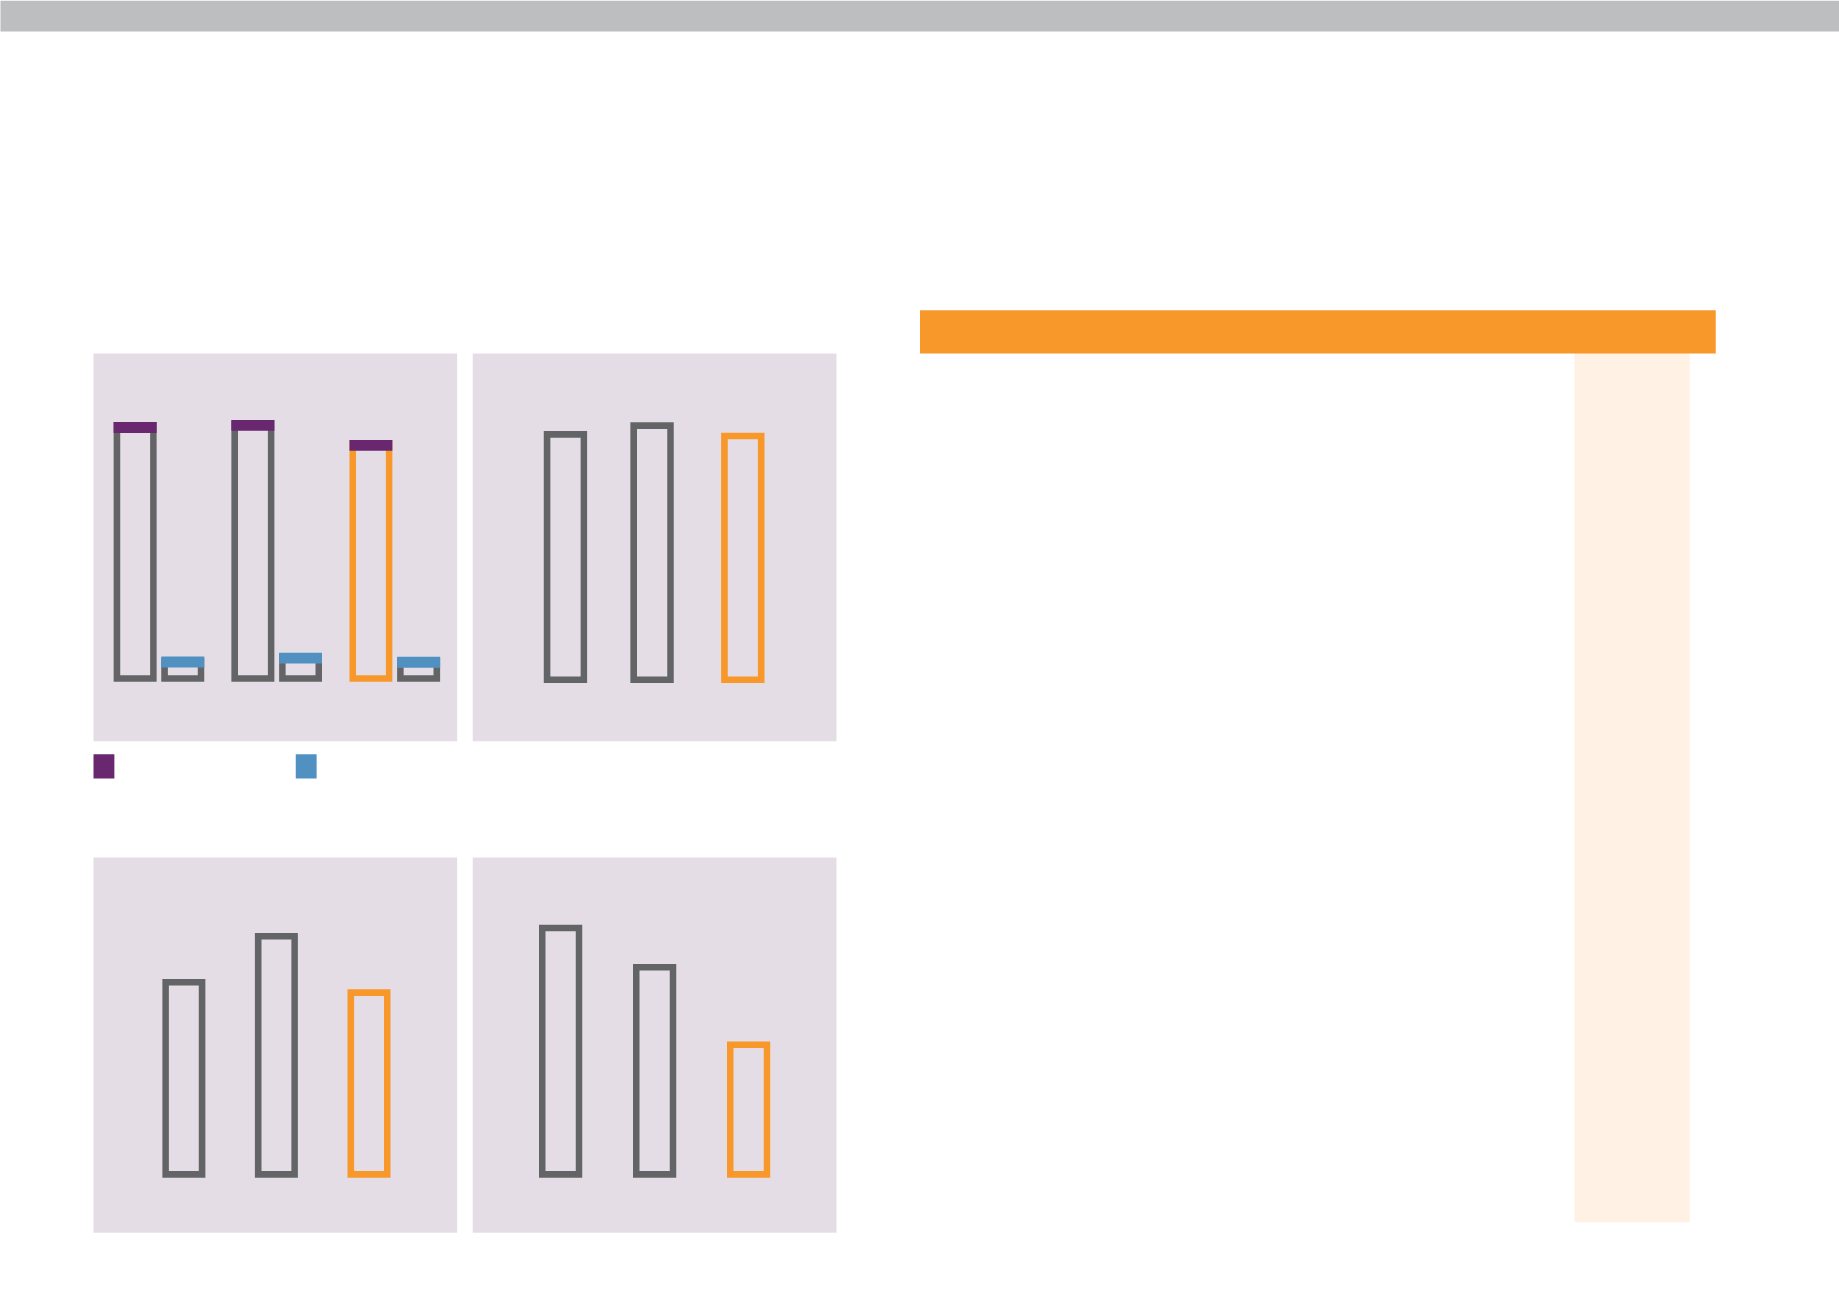
Revenue ($’000)
Total Assets ($’000)
FY2014
FY2015
FY2016
Revenue
By Operating Segments
Marine & Offshore (S$ '000)
55,293
55,621
52,276
Property Development (S$ '000)
5,090
6,036
5,121
Total
60,383
61,657
57,397
By Geographical Areas
Singapore (S$ '000)
46,541
42,530
37,777
Rest of Asia (S$ '000)
5,057
8,784
6,192
Rest of the World (S$ '000)
8,785
10,343
13,428
Total
60,383
61,657
57,397
Operating Results
Gross Profit (S$ '000)
18,045
18,669
17,898
EBITDA (S$ '000)
5,347
(4,507)
(20,102)
Profit/(Loss) Before Tax (S$ '000)
3,388
(7,456)
(23,662)
Profit/(Loss) After Tax (S$ '000)
3,392
(7,689)
(23,830)
Gross Profit Margin (%)
29.9
30.3
31.2
Return on Sales (%)
5.6
-12.5
-41.5
Return on Assets (%)
2.8
-4.8
-20.2
Return on Equity (%)
5.6
-9.2
-38.4
Earnings Per Ordinary Share (Cents)
2.26
-3.54
-10.21
Gross Dividends Per Share (Cents)
0.80
0.00
0.00
Financial Position
Total Assets (S$ '000)
123,343
160,444
117,871
Total Liabilities (S$ '000)
63,236
76,659
55,792
Shareholders' Equity (S$ '000)
60,107
62,313
40,513
NAV Per Ordinary Share (Cents)
31.50
26.71
17.36
Gross Profit ($’000)
Marine & Offshore
Property
Development
NAV Per Ordinary Share (Cents)
5,090
55,293
6,036
55,621
5,121
52,276
FY2015
FY2016
FY2014
FY2015 FY2016
FY2014
18,045 18,669 17,898
FY2014
123,343
FY2015
160,444
FY2016
117,871
FY2014
31.60
FY2015
26.71
FY2016
17.36


